Overview
The Business Intelligence module provides leadership with real-time visibility into every aspect of business performance, replacing spreadsheet reports with live, interactive dashboards.
Key Features
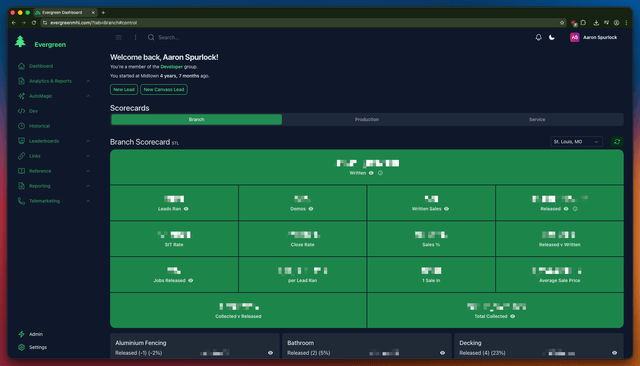
Executive Dashboard
At-a-glance view of critical metrics:
- Revenue (daily, weekly, monthly, YTD)
- Lead flow and conversion rates
- Sales team performance rankings
- Pipeline value and forecast
Custom Report Builder
Drag-and-drop interface for creating custom reports:
- Multiple visualization types (charts, tables, gauges)
- Flexible date ranges and filters
- Scheduled email delivery
- Export to PDF/Excel
Live KPI Tracking
Real-time metrics that update automatically via WebSocket subscriptions, with configurable refresh intervals and automatic reconnection handling.
Trend Analysis
Historical comparisons and pattern detection:
- Year-over-year comparisons
- Seasonality analysis
- Growth rate calculations
- Anomaly detection
Department Scorecards
Specialized scorecards for each business function:
| Scorecard | Key Metrics |
|---|---|
| Branch | Revenue, conversion rates, rep rankings per location |
| Production | Jobs in progress, completion rates, days outstanding |
| Service | Ticket volume, resolution time, customer satisfaction |
| Telemarketing | Calls made, appointments set, conversion rates |
| Canvass | Doors knocked, leads generated, rep performance |
| Technology | System health, API latency, error rates |
Sales Reconciliation
Tools for ensuring data integrity:
- Ghost Appointment Detection: Find appointments without matching jobs
- Split Integrity Checks: Verify sales commission splits are correct
- Data Reconciliation: Compare CRM data against external sources
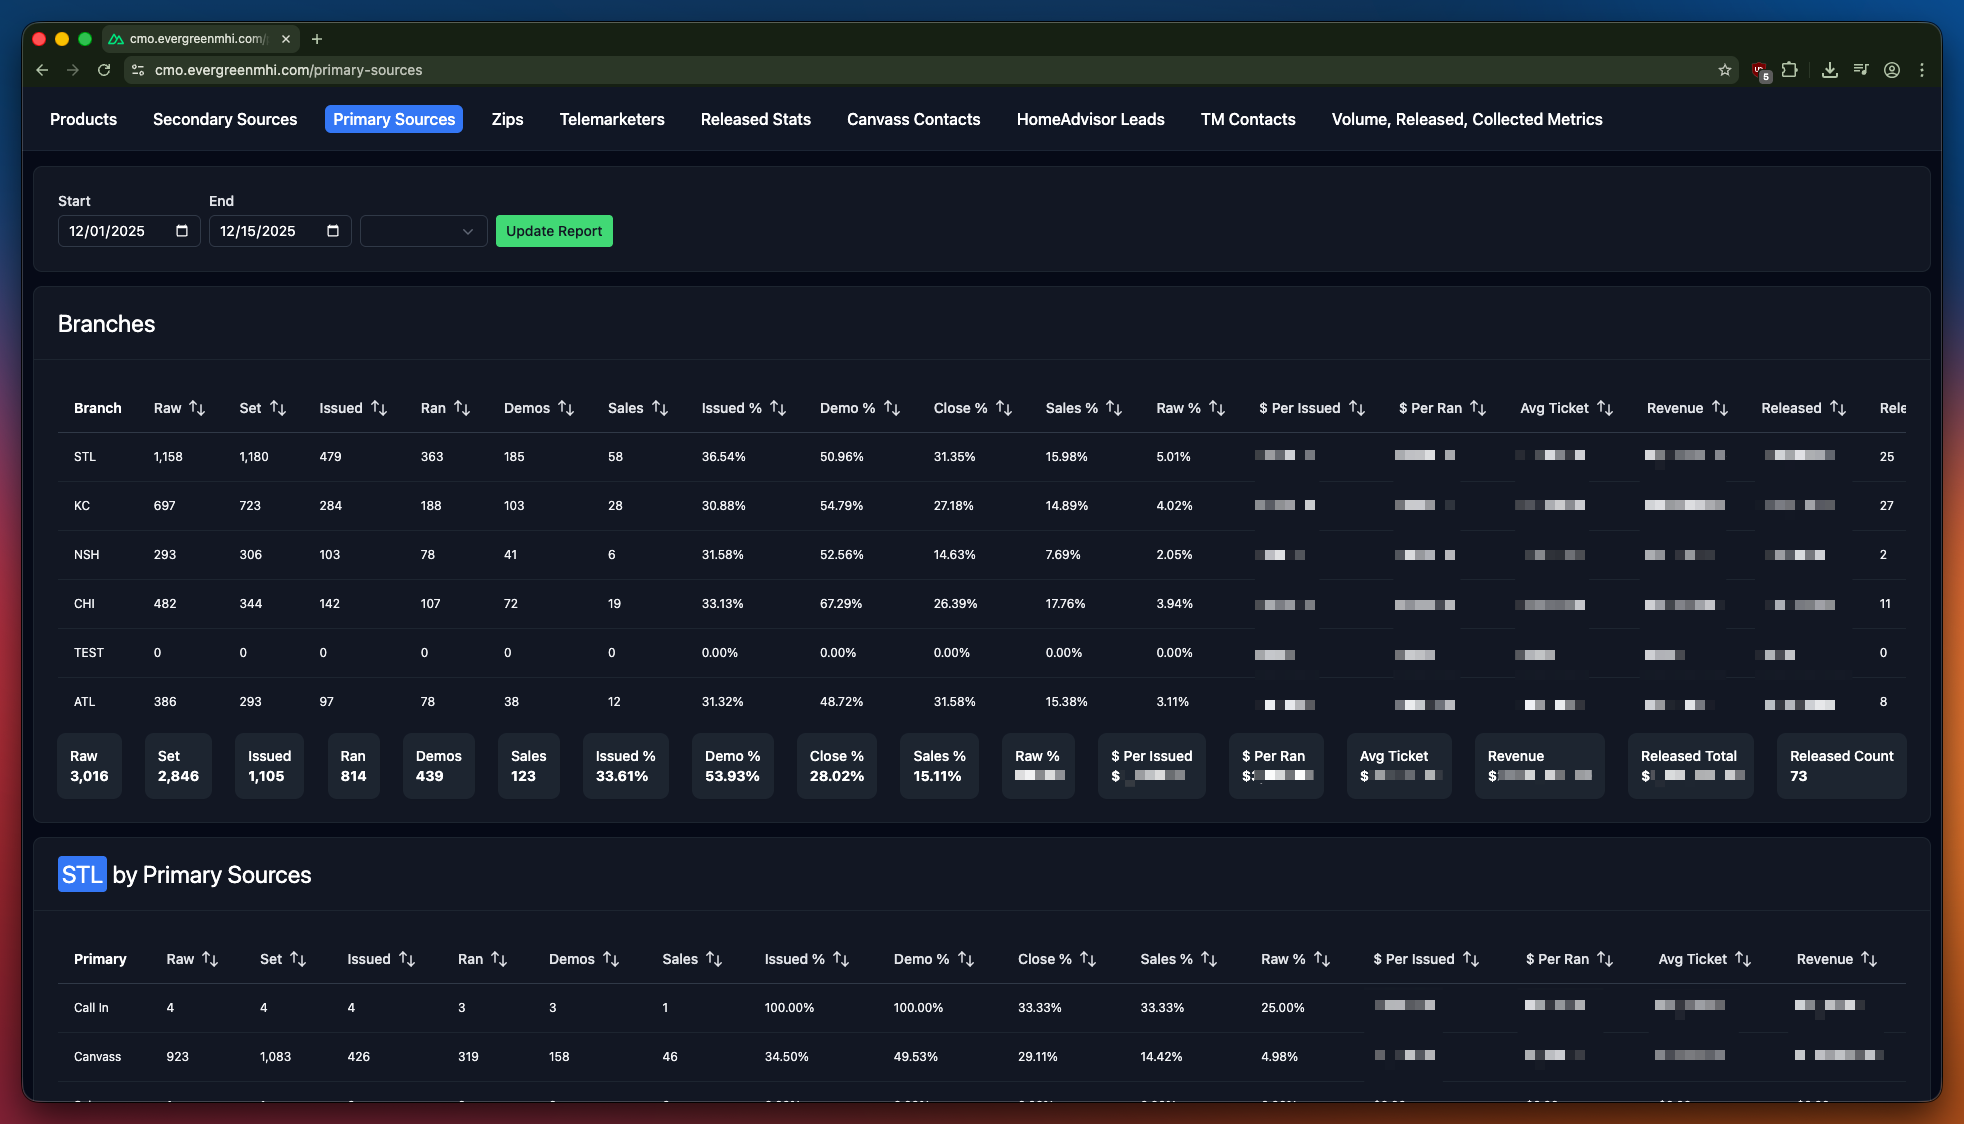
CMO Dashboard (Separate Service)
A dedicated executive analytics platform with its own codebase:
- Real-time KPI Visualization: Live metrics updating in real-time
- Cross-branch Performance: Compare all 5 branches side-by-side
- Marketing ROI Tracking: Attribution for lead sources
- Lead Source Attribution: Track which marketing channels perform best
- Revenue Forecasting: Predictive analytics for planning
The CMO Dashboard is a separate service that pulls from the same data sources, optimized for executive-level reporting without the operational features of the main BI module.
Technical Implementation
Data Architecture
Heavy queries use PostgreSQL materialized views for pre-computed aggregations, refreshed on schedule to keep dashboards snappy while maintaining data freshness.
Caching Strategy
Multi-layer caching for sub-second dashboard loads:
- Materialized views: Pre-computed aggregations in PostgreSQL
- Redis cache: Hot data with TTL-based invalidation
- Client-side: Pinia store with optimistic updates
Real-time Architecture
flowchart LR
    DB[(PostgreSQL)] --> Worker[Background Worker]
    Worker --> Redis[(Redis PubSub)]
    Redis --> WS[WebSocket Server]
    WS --> Client[Dashboard UI]
Impact
The BI module transformed decision-making:
- Instant access to metrics previously requiring manual compilation
- Weekly time savings of 10+ hours in report generation
- Data-driven decisions at every level of the organization
- Early warning system for performance issues